Bocconi UniversityProjects
Seeing More with Less: Human-like Representations in Vision Models


Andrey Gizdov
Senior Advisor
Publication
CVPR 2025 · DOI 10.1109/CVPR52734.2025.00416
Abstract
Large multimodal models (LMMs) typically process visual inputs with uniform resolution across the entire field of view, leading to inefficiencies when non-critical image regions are processed as precisely as key areas. Inspired by the human visual system’s foveated approach, we apply a sampling method to leading architectures such as MDETR, BLIP2, InstructBLIP, LLaVA, and ViLT, and evaluate their performance with variable (foveated) resolution inputs. Results show that foveated sampling boosts accuracy in visual tasks like question answering and object detection under tight pixel budgets, improving performance by up to 2.7% on the GQA dataset, 2.1% on SEED-Bench, and 2.0% on VQAv2 compared to uniform sampling. Furthermore, we show that indiscriminate resolution increases yield diminishing returns, with models achieving up to 80% of their full capability using just 3% of the pixels, even on complex tasks. Foveated sampling prompts more human-like processing within models, such as neuronal selectivity and globally acting self-attention in vision transformers. This paper provides a foundational analysis of foveated sampling’s impact on existing models, suggesting that more efficient architectural adaptations, mimicking human visual processing, are a promising research venue for the community. Potential applications of our findings center low power minimal bandwidth devices (such as UAVs and edge devices), where compact and efficient vision is critical.
1. Introduction
The human visual system excels at processing complex visual scenes by efficiently allocating computational resources—a high-resolution focus at the center of gaze (the fovea) and progressively lower resolution toward the periphery [26, 34, 40]. This variable resolution sampling, known as foveation, allows humans to perceive fine de-
tails where needed while maintaining an awareness of the broader context. This efficient representation enables perception with a limited number of photoreceptors, and a limited diameter of the optic nerve (carrying information from the retina to the brain), balancing detail and field of view (FOV).
In contrast, current large multimodal models (LMMs) in artificial intelligence typically process visual inputs at a uniform resolution across the entire FOV. This approach can lead to inefficiencies, as models may allocate equal computational resources to regions of the image that are less critical for the task at hand. Recent methods, like dynamic tokenization and token merging, aim to alleviate such issues [5, 33]. These techniques embed the full image at the first network layer, and then progressively prune/combine tokens to reduce the computational load in areas of the image that require less precision. However, such methods still embed a full-resolution image input to begin with, which becomes a major constraint in portable systems that cannot do computations on-board and instead send images over a narrow communication channel. For small edge devices and UAVs that utilize LPWANs (Low-Power Wide- Area Networks) the bandwidth is small enough, e.g. 70 kbit/s [10, 36], that transmitting full-resolution images of a wide FOV (typically in size much larger than 70kbit) becomes impractical for real-time visual capabilities. To the best of our knowledge, there is no solution addressing the challenge of computationally efficient vision over a narrow communication channel.
Given the efficiency of the human visual system, a natural question arises: Can we improve the performance and efficiency of LMMs by adopting a foveated sampling scheme similar to that of human vision? In this paper, we present the first study that examines the internal representations and performance of existing LMMs when provided with human-like variable resolution images. By applying a biologically inspired
foveated sampling scheme to state-of-the-art LMM architectures—including MDETR [19], BLIP2 [22], Instruct- BLIP [8], LLaVA [24], and ViLT [20]—we investigate what representational changes emerge. Foveated sampling also reduces effective image size, making it suitable for low bandwidth environments, with less accuracy losses.
Our goal is to understand whether existing LMMs can process visual information in a manner similar to the human visual system and how this affects their performance on complex tasks such as visual question answering (VQA) and object detection under extreme pixel budget constraints. Specifically, we aim to address the following questions: 1. Is foveation beneficial from an information-theoretic perspective? Can variable resolution sampling improve model performance when constrained by a limited number of pixels (or bandwidth)? (Section 3) Answer: Yes, we demonstrate that variable sampling brings gains of up to 2.7%, 2.1%, and 2.0% in accuracy on the GQA [17], SEED-Bench [21], and VQAv2 [13] datasets, respectively, compared to uniform sampling under the same pixel budget. In object detection, variable sampling brings gains of up to 2.2% on the COCO dataset for vision-only models. 2. What are the diminishing returns of increasing image resolution? How does scaling image resolution affect model performance, and is there a point beyond which additional pixels provide minimal benefit? (Section 4) Answer: We find that models achieve up to 80% of their full-resolution performance using just 3% of the pixels on complex visual tasks, highlighting the diminishing returns of increased image resolution.
3. Does foveation induce human-like representations in LMMs? How does variable sampling affect the internal mechanisms of models, such as attention and feature representation? (Section 5) Answer: We discover that variable sampling induces human-like processing strategies within models, such as neuronal selectivity in CNNs and more globally acting self-attention mechanisms in vision transformers, common in many LMMs. Importantly, we note that the paper does not make computational efficiency claims by making architectural changes to accommodate foveated images, and does not explore multiple fixation points. We aim to keep architectures as they are, using a single fixation, and provide the first comprehensive analysis of what performance is possible from a purely information theoretic perspective. This allows us to compare and evaluate against existing baselines, while still offering insight into the learned representations. While this paper does not claim gains in computational efficiency, we advocate that foveated architectures are promising, particularly in minimal bandwidth/computation scenarios. We hope future works will explore the adaptation of LMM architectures to variable-sampling grids, inspired by human vision.
2. Experimental setup
2.1. Model architectures
VQA. We utilize several state-of-the-art vision-language models to evaluate the impact of foveation on complex visual tasks, specifically employing BLIP2 [22], ViLT [20], LLaVa [24], MDETR [19], and InstructBLIP [8].
Object detection. Most questions in VQA are related to objects, their attributes, relationships and locations. Thus, understanding the representations learned in LMMs requires a foundational understanding of vision-only models under foveation. For this reason, later on in this work we also evaluate the performance of several object detectors with the same sampling schemes. The models we utilize for object detection are the Mask-RCNN [16] and DETR [6].
2.2. Information-matched images
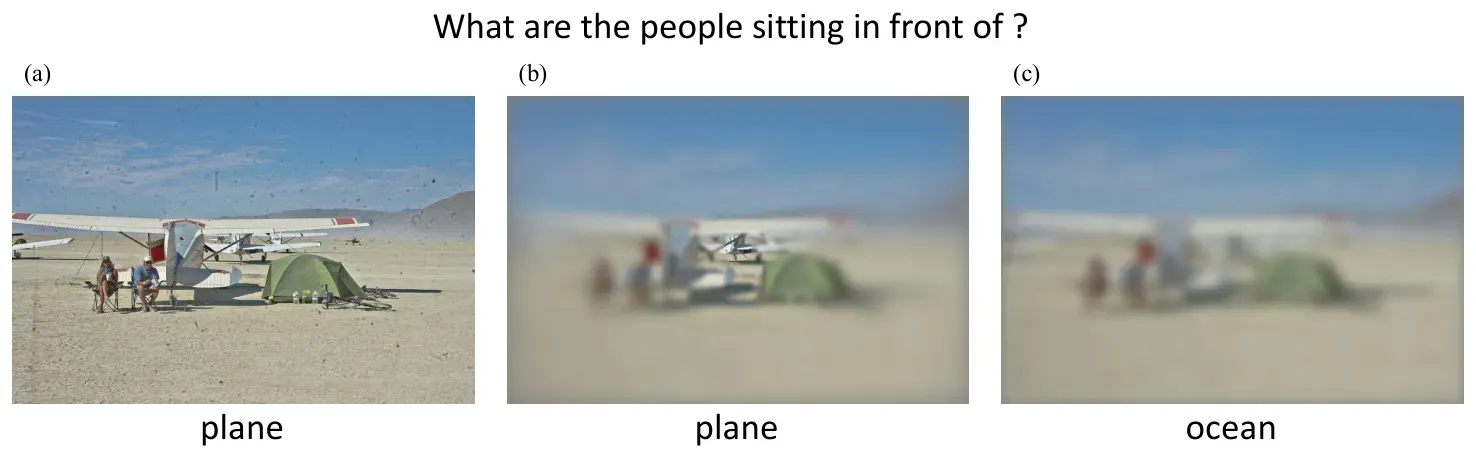
Our first claim is that foveation is beneficial from an information-theoretic perspective. To establish this claim, we introduce the concept of information-matched images. These are pairs of images that contain an identical number of samples (pixels) but differ in how these samples are distributed across the image (Figure 1).
Formally, let I ∈RW ×H×3 be an image from any dataset, where W and H are the width and height of the image, respectively, and 3 corresponds to the RGB color channels. We define a sampling map S : [W] × [H] →{0, 1}, where S(x, y) = 1 indicates that the pixel at position (x, y) is sampled, and S(x, y) = 0 otherwise. The total number of samples is given by N = PW
y=1 S(x, y). To create information-matched images, we generate two sampling maps, Svar and Suni, corresponding to variable (foveated) and uniform sampling schemes, respectively. These sampling maps can be visualized as dim-white dots overlaid on the original image in Figure 1. They have the same total number of samples N:
y=1 Suni(x, y). For each sampling map, we extract the sampled pixels from the original image:
Since the sampled pixels do not cover the entire image, and we aim to preserve architectures as they are, we apply an interpolation function to reconstruct the image at the original spatial dimensions. Let I denote the interpolation operator (e.g., bilinear interpolation). The final image is (Figure 2):
By selecting N s.t. N W ×H = 0.03, for example, we force a 3% sampling density and so on for 10% etc. Ensuring that both sampling schemes use the same number of samples N and images of the same dimensions, we create pairs of images that are information-matched. This allows us to fairly compare the impact of variable versus uniform sampling on model performance. The specific functions we use, Svar, and Suni, are not critical to our results and we refer the reader to the Supplementary ”Sampling scheme” section for specific implementation. In this paper, Svar follows models of the human visual system by Wilson and Bergen [44] and Poggio et al. [30], Suni picks samples uniformly in a log-polar grid, and Sbaseline, naturally, picks all pixels in the image.
Fixation point. For technical simplicity we arbitrarily picked the center of the image as the location with highest sample density in Svar; as we do not evaluate multiple fixations in our models, picking the middle is intuitively the easiest choice for a single fixation. We dedicate Section 3.2 to demonstrating that the fixation point location is arbitrary and not critical to our claims.
2.3. Training paradigm
VQA. We abstained from training most LMMs due to size constraints. Namely, models BLIP2 [22], ViLT [20], LLaVa [24] and InstructBLIP [8] were only evaluated on the datasets discussed bellow using original pretrained
checkpoints. For example, BLIP2 was tested on versions of GQA [17], VQAv2 [13] and SEEDBench [21] that consisted of images with variable sampling (Figure 2b), or uniform sampling (Figure 2c), both never seen during training. Similarly for ViLT, LLaVa and InstructBLIP. However, since we make claims about learned representations, we did fully train the DETR [6] object detection model using a 3% sampling density. This model is used in an LMM, as MDETR [19], and is the entire visual backbone of that LMM. An additional BERT-based transformer for language and the visual embeddings are fused in a transformer encoder-decoder (see Supplementary ”Architectures” section for details). We trained DETR from scratch, including the backbone (ResNet101 [15]) which we also pretrained. Our training consisted of pre-processing the necessary datasets (ImageNet, COCO, GQA) with the sampling filters at the 3% density, then training the backbone, then the full DETR model, and then fine-tuning the MDETR on GQA. For hyperparameters, we followed the ResNet101, DETR and MDETR authors, using the hyperparameters in the original papers. As such, we have three DETR and MDETR models, one for each input paradigm (baseline, variable at 3%, uniform at 3%). Object detection. We trained both DETR and MaskR- CNN [16] from scratch, as described in the above paragraph, including their backbones using original parameters.
3. Foveation improves performance
It is clear that providing input images of worse resolution will negatively impact performance, regardless of whether that resolution is distributed in a foveal, i.e. variable, fashion (Figure 1a) or a uniform one (Figure 1b). Having established the concept of information-matched images (Section 2.2), we investigate how the distribution of information alone affects performance. We show that a foveal distribution benefits visual tasks more compared to a uniform one. Uniform sampling as a baseline. We felt it natural to use uniform sampling as a baseline to compare with for two reasons: (1) uniform sampling is the same as downscaling an image in the most trivial sense. This is the most common practice for making images more compact. We think a
Table 1. Performance on visual question answering using images of 3% sample density.
Model | Dataset | Uniform | Variable | Full |
|---|---|---|---|---|
ViLT [20] | VQAv2 [13] | 62.9 | 64.9 | 81.1 |
MDETR [19] | GQA [17] | 44.1 | 46.8 | 61.7 |
BLIP2 [22] | GQA | 40.7 | 42.3 | 44.0 |
BLIP2 | VQAv2 | 56.2 | 57.9 | 63.1 |
InstructBLIP [8] | VQAv2 | 66.5 | 66.4 | 73.5 |
LLaVa-v1.5 [24] | VQAv2 | 65.1 | 65.9 | 73.1 |
comparison here will be most useful to the community. (2) Only uniform sampling allows fair comparison with present methods (which use uniform high-resolution images), given that we need to maintain information-matching.
3.1. With a 3% sampling density
VQA. We evaluated several pretrained large multimodal models (LMMs) on the VQA task under the three sampling schemes: baseline (full resolution), variable sampling (foveation), and uniform sampling, all at a 3% sampling density (that is N W ×H = 0.03, Section 2.2). Visual question answering (VQA) is a fundamental visual task and requires both the perception of subtle cues and fine details related to object relations, interactions, and causality in a scene. Using the ViLT model on the VQAv2 dataset, we observed that despite the drastic reduction in pixel count, the model achieved approximately 80% of its full-resolution performance. Specifically, the mean accuracy on the validation split was 81.1% for the baseline, 64.9% for the variable sampling, and 62.9% for the uniform sampling (Mvar = 64.9±19.8%, Muni = 62.9±19.9%). Similarly, the LLaVA model evaluated on the VQAv2 test-dev set achieved a total accuracy of 65.9% with variable sampling, compared to 65.1% with uniform sampling and 73.1% at full resolution. We also tested the MDETR model on the GQA dataset. At a 3% sampling density, the model achieved 46.8% accuracy with variable sampling, outperforming the uniform sampling result of 44.1% (t[4] = 2.32, p = 0.04). This represents 77% of the full-resolution performance (61.7% accuracy). Table 1 reflects those results. On BLIP2 [22]. Using the SEEDBench [21] dataset on BLIP2 [22], variable sampling outperformed uniform sampling by 2.1%, achieving 48.6% vs. 46.5% total accuracy (t[14232] = −6.00, p < 1 × 10⁻⁶), Figure 3. Notably,
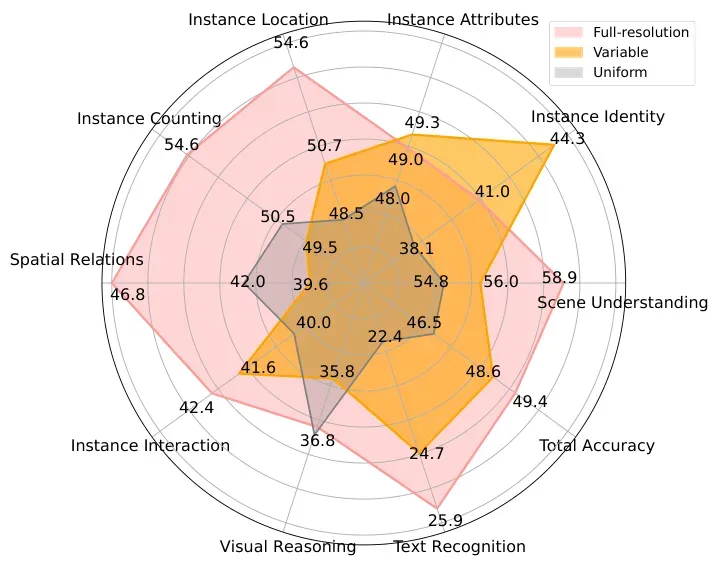
in some question types such as ”Instance Identity,” BLIP2 with variable sampling at 3% density even surpassed the full-resolution baseline. That is, BLIP2 using images containing 3% of the information performs better than BLIP2 using images containing 100% of the information. This result is not a mistake and is also reflected in Figure 5b, where BLIP2 performs better than its baseline on GQA with 30% of samples. We find those results as much exciting as puzzling. They were a surprising finding and, while not the focus of this paper, we hope to explore them in future works. We hypothesize that the selective blur in the variable scheme serves as an ”attention direction” mechanism at the input level, which was perhaps not learned sufficiently well during training (hence why the model can benefit from this modality).
3.2. Fixation point bias
Ablation. The datasets under review, GQA, VQAv2, and SEED-Bench, are largely web-scraped and it is natural that they occasionally concentrate on objects positioned at the center of the image, directly aligning with our fixation. At this juncture, the reader might be tempted to accredit the benefits of variable sampling to merely coincide with the pre-existing photographer bias in the datasets. We demonstrate that this is not the case and provide an ablation with fixations positioned close to each corner (see Table 2). The same evaluation is available for other LMMs in the Supplementary ”VQA” section. As a secondary control, we also show that the underlying object detection models are almost fixation point agnostic (see below). Object detection. As an additional control for fixation point bias, and as a gateway to explore the results achieved on the complex VQA task, we evaluated the behavior of several models on the underlying task of object detection [23], showing that detection performance is mostly agnostic to fixation point location. For this task, we utilized the DETR (also used for VQA with modulation, as MDETR) and Mask-RCNN architectures on the COCO [23] dataset. COCO is most commonly used for object detection, al-
Table 2. 3% density with corner fixations MDETR [19] on GQA [17]. Uniform refers to uniform sampling, and BL, BR, TL, and TR represent variable sampling with fixations shifted from the center to the bottom-left, bottom-right, etc. directions respectively. Each fixation is 100 pixels away from the center diagonally.
Metric | Uniform | BL | BR | TL | TR |
|---|---|---|---|---|---|
Total | 44.1 | 45.2 | 45.4 | 45.0 | 45.5 |
Attr | 57.6 | 56.1 | 57.0 | 56.3 | 58.1 |
Cat | 61.3 | 64.6 | 64.4 | 63.2 | 62.9 |
Global | 93.3 | 94.4 | 94.4 | 94.0 | 93.9 |
Obj | 89.9 | 90.5 | 90.7 | 90.3 | 90.7 |
Rel | 34.2 | 36.1 | 35.9 | 35.8 | 36.0 |
though it recently saw many uses in large-scale pre-training of LMMs due to its semantic richness (annotations have object location, size, mask, caption etc.). Indeed, all of our LMMs (MDETR, BLIP2, InstructBLIP, LLaVA, ViLT) were trained on COCO in various modalities, which is important for our connection to VQA. In this section, we consider the task of object detection, which, due to being semantically richer than VQA, allows us to measure the degree to which a photographer bias artificially benefits the variable model. The following are two experiments (1), (2) that demonstrate a variable model outperforms a uniform one irrespective of fixation location. Creating annotation bins (1). Consider the COCO validation set V = I1, I2, . . . , I5,000, where Ii ∈ZWi×Hi×3
corresponds to the i-th image in the set. There are 5000 images in the COCO validation split, each in RGB format (hence the 3-dimensional domain of Ii). Define a square of size D × D (D < Wi, D < Hi for all i). For instance, D could be 200, since even the smallest images in COCO are larger. Center this square on each validation image, calling the area inside it the high-resolution area (HRA). For each ground truth annotation, compute P
A, the fraction of its pixel mask area inside the HRA (Figure 4a). This metric, the high-resolution inclusion degree (or inclusion degree), measures how much of the annotation is within the HRA. The inclusion degree varies with D. For example, an object might have an inclusion degree of 0.5 for a 200 × 200
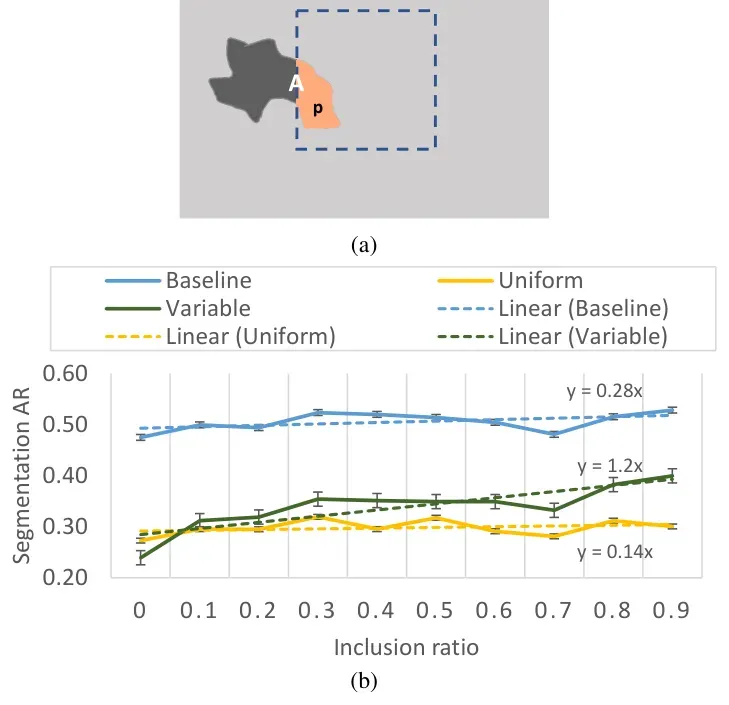
HRA, but 0.3 for a 150 × 150 HRA. We tested HRA sizes from 100 × 100 to 250 × 250 in 10-pixel increments, with consistent results across sizes. Annotations are then binned by inclusion degree. The set G0.0−0.1 contains annotations with inclusion degrees between 0.0 and 0.1, G0.1−0.2 includes those between 0.1 and 0.2, and so on, forming ten bins: G0.0−0.1, G0.1−0.2, ..., G0.9−1.0. Their union covers the entire validation set. Figure 4b shows model Average Recall (AR) across these bins, revealing that variable sampling prevails as soon as 10%- 20% of the object area is inside the HRA (x = 0.1). Uniform sampling prevails where very little to no part of an object is close to the fixation point (x = 0). The conclusion is that, put bluntly, a fixation point placed imperfectly will almost always be better than uniformly sampling the image. Counting samples (2). As an additional control, we constructed an annotation set containing only objects encompassed by an identical sample count, varying only in its distribution pattern: variable or uniform (see Figure 1). The results show a similar performance gap of ∼2.0% in favor of the variable model (See Supplementary ”Object detection” section).
4. Diminishing returns of image resolution
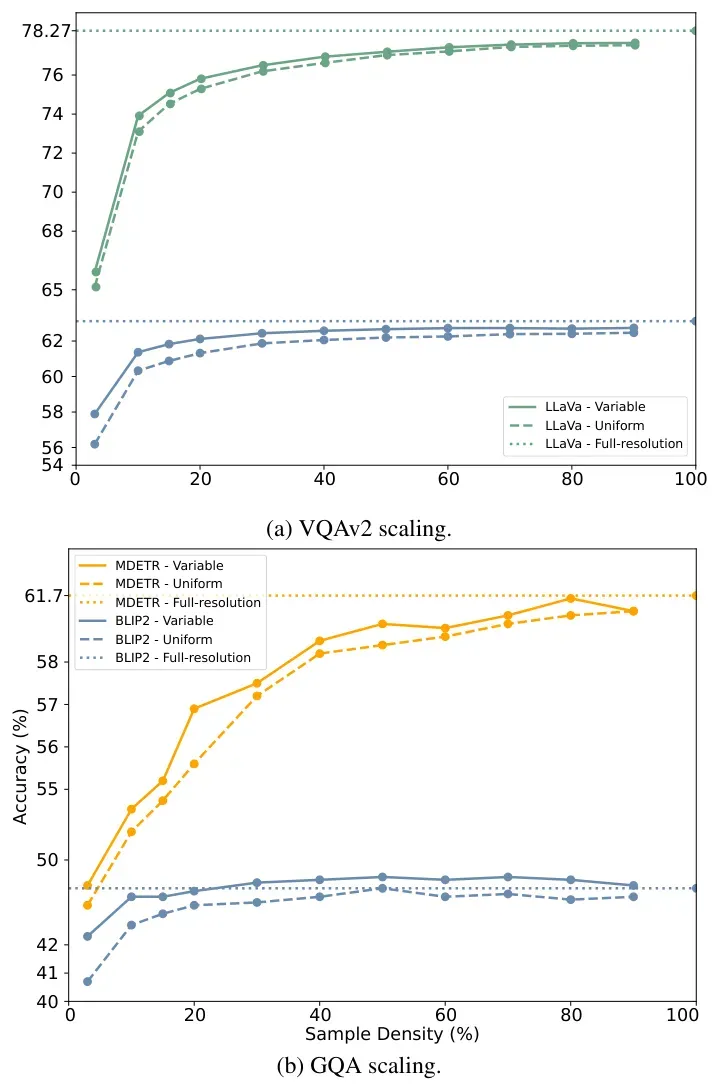
We now refer the reader to Figure 5. We interestingly note the pattern of diminishing returns that appears prevalently with the scaling of resolution. The benefit exhibited by the variable sampling at the 3% sampling density (Section 3.1) is evident throughout the entire range of densities. The benefit of variable sampling is larger for lower sampling densities. We attribute this to texture and finegrained detail. At the 3% density, texture and fine-grained detail are perfectly visible at the center of fixation with variable sampling, while not at all visible in the uniform sampling paradigm. The more we increase the sample density, the more this competitive edge of the variable sampling approach disappears, as the uniform grid begins to capture finer and finer details. We conclude that texture and fine-grained details are crucial for visual tasks, as already shown in literature [32, 41].
5. Human-like representations
We now investigate the internal representations of the models to understand the behavior observed in earlier experiments. Specifically, we explore differences in learned representations between the two sampling schemes, focusing on filter kernels, neuronal activations, and their impact on transformer self-attention. (1) Our analysis uses MDETR, which is the only model we trained, but a vision transformer module is common in MDETR, ViLT, BLIP2, InstructBLIP, and LLaVa (granted, in different scales). (2) Aside from this architectural similarity, the aforementioned models all
show a quantitatively similar to MDETR (Figure 5) pattern in performance: all densities show an improvement with variable sampling, and all models converge to a baseline performance at a logarithmic rate. For these two reasons, we consider the representations of the vision transformer in MDETR as sufficiently representative for our discussion of ”what happens in vision transformers as a consequence of foveation?”. I. Foveation induces more globally-acting attention in vision transformers. In transformer models like MDETR, self-attention allows each token (representing an image patch) to attend to other tokens, integrating information across the image. We hypothesize that variable sampling encourages the model to attend more globally, effectively combining high-resolution details from the center with contextual information from the periphery. Formally, we follow [28] and define the attention distance di for each token i as the average spatial distance to all other
tokens, weighted by the attention weights. Mathematically, let Aij denote the attention weight from token i to token j, and pi = (xi, yi) be the spatial position of token i. Then:
where N is the total number of tokens, and ∥pi −pj∥is the Euclidean distance between tokens i and j. A larger di indicates that token i attends to more distant tokens, implying a more global attention mechanism. The attention distance
¯d is averaged across tokens and images for each layer of the transformer’s encoder during inference on the COCO validation set using the trained MDETR model.
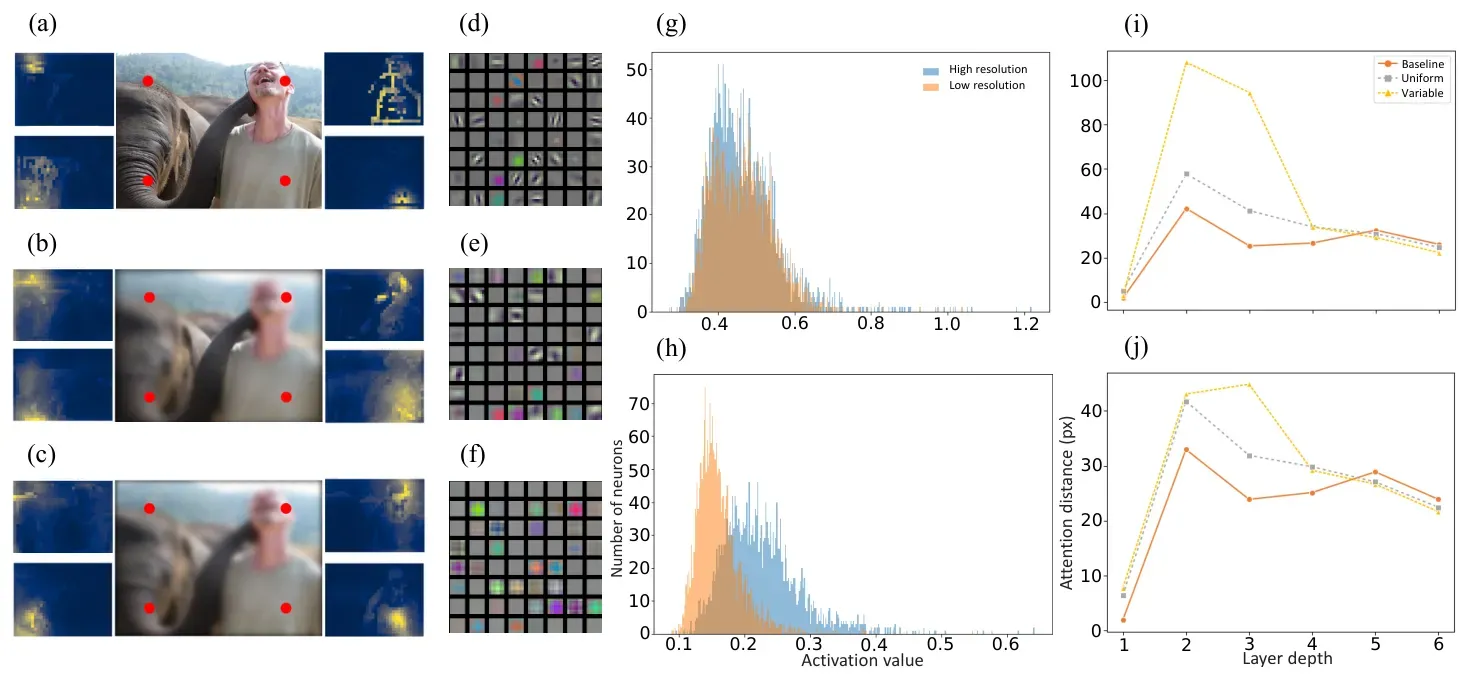
This computation is performed separately for models trained with variable sampling and uniform sampling. Figure 6(i,j) illustrates how ¯d varies across transformer layers. (i) considers only tokens located within the central 10% of the image, coinciding with our fixation point and corresponding to the highest acuity regions, analogous to the densely packed ganglion cells in the human fovea [43]. In contrast, (j) shows the same metric, but for tokens located within the outermost 5% of the image, analogous to the peripheral regions of the human retina, where ganglion cells’ density is significantly lower and their receptive fields are much wider, leading to reduced visual acuity and a greater
reliance on broader contextual information [4].
Our results show that models trained with variable sampling exhibit significantly larger ¯d across several layers compared to those trained with uniform sampling, as illustrated in Figure 6(i,j), layers 2 and 3. This quantitative measure also aligns with the qualitative visualization of attention maps we see in Figure 6(a,b,c). The red tokens seem to attend more globally in the model trained with variable images (b), compared to the one trained with uniform images (a,c). There is an evident beneficial information-flow from the periphery to the center and vice-versa, similar to the human visual cortex [38]. II. Single model generalizes to detect multi-resolutionspanning objects by allowing resolution-specialization in CNNs. The convolutional kernels in CNN-based models are commonly applied uniformly across the entire image. It is therefore not clear if and how CNNs adapt when presented with multiple resolutions within the same object instance (as we have in for example Figure 1a). We have demonstrated improved performance of the variable sampling approach, and looking-under-the-hood we now pose the question: what internal adaptations occur in CNN backbone models to facilitate beneficial information-flow from low to high-resolution parts of a single object. We hypothesized that the variable resolution trained models learned a mixed resolution representation, where some neurons
specialize on low-resolutions and other neurons on highresolutions. Whether this occurs is not a trivial question, since it is entirely possible that the neurons of the network have learned the average resolution in our training set only: producing high dot-products (activations) for midresolution occupying object segments and low everywhere else. Formally, our hypothesis becomes:
where P0, P1 represent the distributions of neuronal activations when the backbone network (ResNet101, variable trained) is inferenced with crops from central (primarily high-resolution) locations, P0, and crops from peripheral (primarily low-resolution) locations, P1. Due to P0, P1’s high dimensionality, we employed a classification-based approach, rejecting H0 at α = 0.01 (see Supplementary ”Human-like representations” section). We now refer the reader to Figure 6(g,h). The histograms show the maximal neuronal activation values in several filters from the deep layers of the ResNet101, backbone for our main detection models (MaskRCNN and DETR) and MDETR LMM. We observe that while some filters seem universal (Figure 6g) w.r.t. the resolution of crops, other filters (Figure 6h) exhibit selectivity, firing actively from highresolution crops only. This indeed suggests that the network exhibits neuronal selectivity based on resolution, similar to the human brain [27, 35].
6. Related work
Prior computational work explored the contribution of multiple resolutions to model robustness and improved performance [1, 12]. Some works studied aspects of non-uniform sampling in the visual FOV, including foveal schemes, where samples are distributed densely around a fixation point in the FOV and more sparsely in the periphery [2, 25, 29], but proposing new architectures rather than utilizing existing ones. Early studies, developed models of the human visual system to evaluate the capabilities and limitations of human peripheral vision, but did not address the implications of these models on artificial systems [3, 11]. Followup studies evaluated the impact of these foveated texture-based input representations on artificial vision systems including DNNs, showing that peripheral texture encoding leads to representations with greater generalization, sensitivity to high-spatial frequency and robustness to occlusion [9, 14]. A neuro-computational study suggested that the advantage of peripheral over central vision is due to intrinsic usefulness of features carried by peripheral vision, generating a greater spreading transform in the representational space [42]. The model showed that the two pathways correlate with their neural substrates, LOC and PPA in the brain, but applied to scene classification, the model provides limited insight, as the task can be often performed well at
extremely poor resolutions [39]. Another study suggested that blurry peripheral vision may have evolved to optimize object recognition [31]. Applying DNNs to foveated images around objects of interest, the study showed that DNNs’ performance peaked at the human blur decay setting, also benefiting from reduced false detections in the blurry periphery. Other studies investigated the effects of cortical magnification, a brain mechanism that allocates more processing units to the densely sampled area of the foveal image [7, 18]. These methods use foveated videos to fit models into embedded systems, achieving a 4× speed-up in frame rate, but showing only a small decrease in recall within the restricted foveal region.
A key limitation of these studies is the absence of a robust comparison with large vision models used on large-scale, complex, datasets such as GQA [17], SEED- Bench [21], and VQAv2 [13]. Furthermore, these studies lack a comparison with prevalent architectures such MDETR [19], BLIP2 [22], InstructBLIP [8], LLaVA [24], and ViLT [20]. Lastly, none of the studies provided a systematic analysis on VQA model performance based on image resolution, nor explored the representations that emerge in existing architectures as a consequence of foveation.
7. Conclusions
Growing computational demands are a pain point in the field [37, 46]. We show that efficiency is possible from an information-theoretical perspective. Leading LMMs achieve 80% of their performance with only 3% of the pixels in an image, and almost maximal performance with 50%. We present the case that instead of indiscriminately upscaling images to higher resolutions, the community can benefit from exploring architectural adaptations that utilize a non-uniform, biologically-inspired, image representation.
In VQA, we demonstrate that LMMs benefit from variable sampling on multiple datasets — VQAv2 [13], GQA [17], and SEEDBench [21] — compared to uniform sampling. This is an outstanding finding, mainly from two perspectives. First, by considering the fact that we arbitrarily chose the highest resolution area location of the image (achieving consistent results on central and corner fixations), while the cues required to answer the questions can be anywhere in the scene. Second, the improvement is achieved with a single fixation, without any scanning across the FOV. Humans usually need a few fixations to complete most visual tasks [45], also simpler AI models [2]. Multiple fixations with foveation have potential to drastically improve performance and we hope to explore that in the future. We also reveal human-like, global, self-attention in the transformer, and resolution specialization. The results show the potential of the biologically inspired image representation in future LMM systems, particularly when growing computational demands are a pain point in the field.
Acknowledgements
We are grateful to Botond Szabó and Carlo Baldassi for their insightful advice and helpful discussions. This work was supported by the BAINSA-WIS Program for Collaborative Research in AI and by research grants acknowledged in the published paper.